自定义echarts图表组件相对于图表组件,提供给大屏设计者更大的、个性化编程的创造空间。要使用本组件,用户应具备以下基础技能:
- 掌握了一定的JavaScript基础知识;
- 对百度echarts有一定的了解;
组件配置项配置
配置
基础属性

组件位置:包括组件的横坐标和纵坐标,单位为px;横坐标为组件左上角距离页面左边界的像素距离,纵坐标为组件左上角距离页面上边界的像素距离。
组件尺寸:包括组件的宽度和高度,单位为px;可单击比例锁 锁定组件宽高比,等比例调整组件的宽高。再次单击进行解锁,解锁后宽高比不受限制。比例锁默认不锁定。
旋转:以组件的中心为中心点,进行旋转,单位为度(°)。手动输入角度值,控制组件的旋转角度;
- 单击
 图标,控制组件左右翻转样式;
 - 单击
 图标,控制组件上下翻转样式。
透明:取值范围为0~100%。为0%时,组件隐藏;为100%时,组件完全显示。默认为100%。
组件属性
图表类型:指定图表类型后,大屏将加载对应的JS文件(echarts为v4.9.8)
自定义JS脚本:通过此开关,可以优先使用在页面设置中引入的echarts脚本文件进行图表渲染。例如,一些高级特性需要v5版本才有的,可以打开此开关,在页面设置中引文echarts V5版本的js脚本文件。
V6.8.2版本开始,乐创者服务根目录/lczCommon/charts/echarts/5.2.1下自带了echartsV5.2.1版本的打包js文件。
页面配置中引入echarts的JS文件时,可以按照以下方式引入:
../lczCommon/charts/echarts/5.2.1/echarts.min.js
注意:如果要引入多个echarts相关文件,要注意文件引入的顺序。
初始样式:图表样式脚本。
事件配置:为空时,将按数智大屏的规则进行处理;配置后,将覆盖数智大屏的处理结果。
例如:在自定义折线图的交互中配置,点击时大屏变量取图表变量chartValue值。
事件配置为空时,大屏变量取值为点击分类对应的系列值;
事件配置中配置:“outValues.chartValue = params.seriesName”,则最后大屏变量取值为点击分类对应的系列名称。
数据
组件数据格式
| 字段 | 说明 |
|---|---|
| 任意 | 字段 说明 |
| 任意 所配数据源中能获取到的所有字段都可以被组件使用。 | |
| 。 |
交互
支持鼠标点击事件。当点击图表时,触发交互事件:设置大屏变量、打开超链接、设置可见、设置JS事件。
例:
添加事件:点击时设置大屏变量“变量1”=图表数据“chartValue”。添加标题组件,数据为表达式“{变量1}”。

案例
制作步骤
| 经度 | 纬度 | 位置 | 名称 | 值 |
|---|---|---|---|---|
| “120.271679” | “30.521975” | “A” | “A” | “100” |
| “106.36536” | “35.240278” | “B” | “B” | “200” |
| “107.727665” | “25.556365” | “C” | “C” | “300” |
2.编写echarts构建代码
const longitude = [...new Set(datas.map((v) => v.经度))];
const latitude = [...new Set(datas.map((v) => v.纬度))];
const geoCoordList = longitude.map((item,index) => {
    return [item, latitude[index]];
  });
const res = []
datas.forEach((item, i) => {
    res.push({
      name: item.名称,
      value: geoCoordList[i].concat(item.值)
    })
  console.log(res,'res')
  return res
});
let series = [];
const china = 'https://geo.datav.aliyun.com/areas_v3/bound/100000_full.json'
//引入中国geoJson
$.getJSON(china, function (geoJson) {
  echarts.registerMap('china', geoJson);
  series.push({
      type: 'map',
      coordinateSystem: 'geo',
      showLegendSymbol: false,
      tooltip:{
        show:false
      },
      label: {
        normal: {
          show: false
        },
        emphasis: {
          show: false
        }
      },
      roam: false,
      itemStyle: {
          normal: {
              areaColor: '#01215c',
              borderColor: '#3074d0',
              borderWidth: 1
          },
          emphasis: {
              areaColor: '#01215c'
          }
      },
  },{
    name: '散点',
      type: 'effectScatter',
      coordinateSystem: 'geo',
      data: res,
      symbolSize: 20,
            symbol: 'circle',
      label: {
        normal: {
          show: false
        },
        emphasis: {
          show: false
        }
      } ,
      showEffectOn: 'render',
      itemStyle: {
          normal: {
              color: {
                  type: 'radial',
                  x: 0.5,
                  y: 0.5,
                  r: 0.5,
                  colorStops: [{
                      offset: 0,
                      color: 'rgba(14,245,209,0.2)'
                  }, {
                      offset: 0.8,
                      color: 'rgba(14,245,209,0.2)'
                  }, {
                      offset: 1,
                      color: 'rgba(14,245,209,1)'
                  }],
                  global: false // 缺省为 false
              },
          }

      },
  });
  const option = {
  backgroundColor: '#010347',
  geo: {
      show: true,
      map: 'china',
      label: {
          emphasis: {
              show: true,
              color: '#fff'
          }
      },
      roam: false,
      itemStyle: {
          normal: {
              areaColor: '#01215c',
              borderWidth: 1,//设置外层边框
              borderColor:'#9ffcff',
              shadowColor: 'rgba(0,54,255, 1)',
              shadowBlur: 30
          },
          emphasis:{
              areaColor: '#01215c',
          }
      }
  },
  tooltip: {
    trigger: 'item',
    formatter: function (params){
        return params.name + ' : ' + params.value[2];
    }
  },
  series: series
};
  myChart.setOption(option);
})
案例2:飞线图
案例效果

配置过程
- 准备图表数据(该数据由后台获取)
| 值 | 终点名称 | 终点纬度 | 终点经度 | 起点名称 | 起点纬度 | 起点经度 | |
|---|---|---|---|---|---|---|---|
| 100 | “AC” | “35.240278” | “106.36536” | “as” | “30.521975” | 120.271679 | |
| 200 | “AC” | “25.556365” | “107.727665” | “fs” | “30.521975” | “120.271679” |
- 编写echarts构建代码
const mapStyle = {
    styleJson: [
    {
        featureType: 'water',
        elementType: 'all',
        stylers: {
            color: '#395a75'
        }
    }, {
        featureType: 'land',
        elementType: 'all',
        stylers: {
            color: '#285069'
        }
    }, {
        featureType: 'railway',
        elementType: 'all',

    }, {
        featureType: 'highway',
        elementType: 'all',

    }, {
        featureType: 'highway',
        elementType: 'labels',

    }, {
        featureType: 'arterial',
        elementType: 'geometry',

    }, {
        featureType: 'arterial',
        elementType: 'geometry.fill',
        stylers: {
            color: '#fefefe'
        }
    }, {
        featureType: 'poi',
        elementType: 'all',

    }, {
        featureType: 'green',
        elementType: 'all',

    }, {
        featureType: 'subway',
        elementType: 'all',

    }, {
        featureType: 'manmade',
        elementType: 'all',

    }, {
        featureType: 'local',
        elementType: 'all',

    }, {
        featureType: 'arterial',
        elementType: 'labels',

    }, {
        featureType: 'boundary',
        elementType: 'all',

    }, {
        featureType: 'building',
        elementType: 'all',

    }, {
        featureType: 'label',
        elementType: 'labels.text.fill',

    }]
}

const  geo = {
  map: "bmap",
  polyline: true,
  progressiveThreshold: 100,
  progressive: 400,
  label: {
      emphasis: {
          show: false
      }
  },
  roam: true,
  itemStyle: {
      normal: {
          areaColor: "#E7A060",   //连接线的颜色
          borderColor: "#ff9900"   //移动飞线的颜色
      },
      emphasis: {
          areaColor: "#F300FF"
      }
  }
}


let lineData = []
let pointData = []
for (var i = 0; i < datas.length; i++) {
  let device = datas[i];
  if(!device.终点经度|| !device.终点纬度){
  continue;
  }
  let toName = device.终点名称?device.终点名称:"";
  lineData.push({ "fromName":device.起点名称,"toName":toName,"coords":[ [device.终点经度,device.终点纬度],[device.起点经度,device.起点纬度]]});
  pointData.push({"name":toName,"value":[device.终点经度,device.终点纬度,device.值]});
}
console.log(lineData,'1')
console.log(pointData,'2')

const option = {
  //百度地图样式
  bmap: {
      center: [104.114129, 37.550339],
      zoom: 4,
      roam: true,
      mapStyle: mapStyle
  },
  tooltip : {
      trigger: 'item',
      "formatter": function(res){
          if(res.seriesType==="effectScatter"){
              return res.name+" "+res.value[2]+' 台';
          }

      }
  },
  dataRange: {
      show:false,
      min : 0,
      max : 250,
      calculable : true,
      color: ['#ff3333', 'orange', 'yellow','lime','aqua'],
      textStyle:{
          color:'#fff'
      }
  },
  // 地图飞线样式选项
  geo: geo,
  series: [
    {
      //飞线样式
      name: "a",
      type: "lines",
      coordinateSystem: "bmap",
      zlevel: 2,
      symbol: ['none', 'arrow'],
      symbolSize: 20,
      effect: {
        symbolSize: 5,
        show: true,
        scaleSize: 2,
        period: 20,
        color: '#FFF',
        shadowBlur: 10,
        constantSpeed: 50,
      },
      lineStyle: {
        normal: {
          color: new echarts.graphic.LinearGradient(0, 0, 0, 1, [{
            offset: 0,
            color: '#58B3CC'
            }, {
            offset: 1,
            color: '#ffbf31'
          }], false),
          width: 2,  //飞线粗细
          opacity: 0.3,
          curveness: 0.3
        },
      },
      data:lineData,
    },
    {
      //终点点位样式
      name: "b",
      type: "effectScatter",
      coordinateSystem: "bmap",
      rippleEffect: {
          period: 5,
          scale: 3,
          brushType: "stroke"
      },
      symbolSize : 10,
      itemStyle:{
          normal:{
            "color": "#FF4040"
          },
      },
      label: {
        normal: {
          show: false,
          position: "right",
          formatter: function(res){
            if(res.seriesType==="effectScatter"){
                return '';
            }
          }
        }
      },
      //出发点和终点坐标
      data: pointData,
    }
  ]
};
myChart.setOption(option);
案例3:桥隧线路检测趋势图
案例效果

配置过程
准备图表数据(该数据由后台获取)
[
 {
   "cumulative_value": -0.29,
   "c_name": "临-许",
   "mileage": 0,
   "monitoring_no ": "HH-LPNDC-ZFR01"
 },
 {
   "cumulative_value": -0.11,
   "c_name": "临-许",
   "mileage": 0,
   "monitoring_no ": "HH-LPNDC-ZFR02"
 },
 {
   "cumulative_value": -0.25,
   "c_name": "临-许",
   "mileage": 0,
   "monitoring_no ": "HH-LPNDC-ZFR03"
 }
]
上传自定义js文件
编写echarts构建代码
echarts.registerTransform(ecStat.transform.regression);

const siteInfo = {},
  siteXValues = {}

let dataSource = []
for (let i = 0; i < datas.length; i++) {
  const { c_name, cumulative_value, mileage, no } = datas[i];
  dataSource.push([
    +mileage, +cumulative_value, c_name, no
  ])

  if (!siteInfo[c_name]) {
    siteInfo[c_name] = {
      min: +mileage,
      max: +mileage
    }
  } else {
    const { min, max } = siteInfo[c_name]
    if (min > mileage) siteInfo[c_name].min = +mileage
    if (max < mileage) siteInfo[c_name].max = +mileage
  }
}

const siteLen = Object.keys(siteInfo).length
let siteI = 0

for (const key in siteInfo) {
  siteI++
  let { min, max } = siteInfo[key]
  min = Math.round(min)
  max = Math.round(max)

  if (!siteXValues[min] || (siteXValues[min] && siteXValues[min].type !== 'max')) {
    siteXValues[min] = {
      value: min,
      cName: key.split('-')[0],
      type: 'min'
    }
  }

  if (!siteXValues[max] && siteI === siteLen) {
    siteXValues[max] = {
      value: max,
      cName: key.split('-')[1],
      type: 'max'
    }
  }
}


const dataSourceLen = dataSource.length,
  lastData = dataSourceLen ? dataSource[dataSourceLen - 1] : [],
  lastMileage = !dataSourceLen ? 0 : Math.ceil(lastData[0]),
  dataSpeed = !dataSourceLen ? 0 : Math.floor(dataSourceLen / lastMileage)


function getXVal(val) {
  return siteXValues[val] ? siteXValues[val].cName : ''
}

const option = {
  dataset: [
    {
      source: dataSource
    },
    dataSourceLen ? {
      transform: {
        type: 'ecStat:regression',
        config: { method: 'polynomial', order: 30 }
      }
    }: null
  ],
  tooltip: {
    trigger: 'item',
    backgroundColor: "#000",
    textStyle: {
      color: "#fff"
    },
    formatter: (param) => {
      const { marker, data } = param,
        [x, y, cName, no] = data
      return `
        <dv class='lcz-custom-echart-scatter-tooltip-wrapper'>
          <p class="t-title">${no}</p>
          <div>
            ${marker}
            <span class="t-name">累计沉淀</span>
            <span class="t-val">${y}</span>
          </div>
        </div>
      `
    }
  },
  dataZoom: [
    {
      type: 'inside',
    }
  ],
  xAxis: {
    maxInterval: 1,
    min: dataSourceLen ? dataSource[0].mileage : 0,
    max: dataSourceLen ? dataSource[dataSourceLen - 1].mileage : 10,
    splitLine: {
      show: false
    },
    axisTick: {
      show: false
    },
    axisLabel: {
      formatter: (value) => getXVal(value)
    }
  },
  yAxis: {},
  visualMap: {
    show: false,
    dimension: 1,
    seriesIndex: 1,
    pieces: [
      {
        min: -1,
        max: 1,
        color: 'blue'
      },
      {
        min: 1,
        max: 2,
        color: 'yellow'
      },
      {
        min: -2,
        max: -1,
        color: 'yellow'
      },
      {
        min: 2,
        max: 3,
        color: 'red'
      },
      {
        min: -3,
        max: -2,
        color: 'red'
      }
    ]
  },
  series: [
    {
      name: 'scatter',
      type: 'scatter',
      datasetIndex: 0
    },
    {
      name: 'line',
      type: 'line',
      silent: true,
      datasetIndex: 1,
      symbolSize: 0.1,
      color: ['red'],
      symbol: 'circle',
      tooltip: { show: false },
      label: { show: false }
    },
  ]
};

myChart.setOption(option)
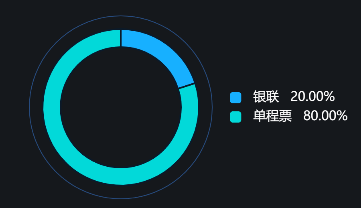
案例4:地铁付款方式占比图
案例效果

配置过程
准备图表数据(该数据由后台获取)
[
 {
     "item": "银联",
     "itemTitle": "",
     "value": 200
 },
 {
     "item": "单程票",
     "itemTitle": "",
     "value": 800
 }
]
编写echarts构建代码
const data1 = [];
var sum = 0;
datas.forEach((item, i) => {
    sum += parseInt(item.item);
    data1.push({
        name: item.item,
        value: item.value,
    });
    return data1;
});
const option = {
    tooltip: {
        show: true,
        confine:true,
              borderWidth:0,
              backgroundColor: "rgba(10,20,30,0.45)",
              textStyle:{
                  fontSize: 13,
            color:'rgba(255,255,255,1)'
        },
        formatter: function (params) {
            let str = params.name + '<br />';
            let value = params.value;
            if (value > 999) {
                let parts = value.toString().split('.');
                parts[0] = parts[0].replace(/\B(?=(\d{3})+(?!\d))/g, ',');
                value = parts.join();
            }
            str += '金额:' + value + '';
            return str;
        },
    },
    legend: {
        top: 'center',
        itemWidth: 14,
        itemHeight: 14,
        right: '5%',
        orient: 'vertical',
        itemGap: 8,
        textStyle: {
            color: '#fff',
            fontSize: 16,
            padding: [0, 0, 0, 10],
        },
        formatter(name) {
            let then = option.series[1].data; //获取series中的data
            let total = 0;
            for (let i = 0; i < then.length; i++) {
                total += parseInt(then[i].value);
            }
            var str = '';
            var p = 0;
            for (let i = 0; i < then.length; i++) {
                if (then[i].name == name) {
                    p = (then[i].value / total) * 100;
                    str = name + '   ' + p.toFixed(2) + '%';
                }
            }
            return str;
        },
    },
    color: ['#17B0FF', '#02D9D9', '#FFED5B', '#FF9F5B', '#545EFF', '#A754FF'],
    series: [
        {
            type: 'pie',
            hoverAnimation: false,
            radius: ['76%', '76%'],
            center: ['35%', '50%'],
            data: [100],
            itemStyle: {
                color: 'transparent',
                borderColor: 'rgb(39,76,128)',
            },
            tooltip: {
                show: false,
            },
            label: {
              show: false,
              position: 'center'
            },
        },
        {
            name: '售票数量',
            type: 'pie',
            //hoverAnimation: false,
            radius: ['50%', '65%'],
            center: ['35%', '50%'],

            label: {
                show: false,
            },
            labelLine: {
                show: false,
            },
            itemStyle: {
                borderColor: '#0a1a2a',
                borderWidth: 2,
            },
            data: data1,
        }
    ],
};

myChart.setOption(option);
//tools.loopShowTooltip(myChart, option, { loopSeries: false,tooltip:true, interval: 2000,seriesIndex: 1,});
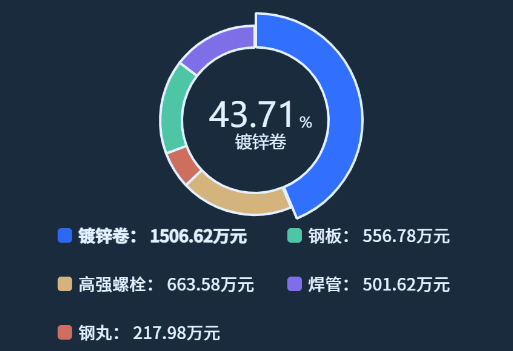
案例5:采购货物类别环图
案例效果

配置过程
准备图表数据(该数据由后台获取)
[
 {
     "类别": "镀锌卷",
     "数值": 1506.62
 },
 {
     "类别": "高强螺栓",
     "数值": 663.58
 },
 {
     "类别": "钢丸",
     "数值": 217.98
 },
 {
     "类别": "钢板",
     "数值": 556.78
 },
 {
     "类别": "焊管",
     "数值": 501.62
 }
]
编写echarts构建代码
var data = [];
var legdata = [];
let sum = 0;


// 计算总和并构建数据
datas.forEach((item,index) => {
    sum += item.数值;

    if(index!==0){
    data.push({
        name: item.类别,
        value: item.数值,
        selected:false
    })}else{
        data.push({
        name: item.类别,
        value: item.数值,
        selected:true
        })
    }
})
datas.forEach((item) => {

    legdata.push(item.类别);
});

console.log(data);

// 默认显示第一个类别的百分比
const defaultCategory = data[0];
const defaultPercentage = (defaultCategory.value / sum * 100).toFixed(2);

const option = {
    color: ['#2B5EEF', '#EFB765', '#E66642', '#51CE96', '#8967E4'],
    tooltip: {
        show: false,
    },
    title: {
         text: "{a|" + defaultPercentage + "}{p|%}\n{b|" + defaultCategory.name + "}",
        x: '50%',  // 水平居中
        y: '35%',  // 垂直居中
        textAlign: 'center',  // 文本水平对齐方式
        textVerticalAlign: 'middle',  // 文本垂直对齐方式
        textStyle: {
            fontSize: '28',
              color: '#fff',
            fontWeight: 'normal',
            fontFamily: 'DIN-Medium',
            rich: {
                a: {
                    fontSize: 28,
                    color: '#fff',
                },
                b: {
                    fontSize: 14,
                    color: '#fff',
                },
                p: {
                    fontSize: 12,  // 调整 % 号的字体大小
                    color: '#fff',
                    padding: [-10, 0, 0, 2]
                }
            }
        }
    },
    legend: {
        show: true,
        icon: 'roundRect',
        orient: 'vertical',
        height:100,
        itemWidth: 12,
        itemHeight: 12,
        bottom: 8,
        selectedMode:false,
        //left: 16,
        itemGap: 26,  // 图例项之间的间隔
        formatter: (name) => {
      if (data.length) {
        const item = data.filter((item) => item.name === name)[0];

        if (!item.selected) {
          return `{a|${name}:}{b| ${item.value}万元}`;
        } else {
          return `{c|${name}:}{c| ${item.value}万元}`;
        }
      }
    },
        textStyle: {
            rich: {
                a: {
                    color: '#fff',
                    fontSize: 14,
                    fontFamily: 'SourceHanSansCN-Medium',
                },
                b: {
                    color: '#fff',
                    fontSize: 14,
                    fontFamily: 'SourceHanSansCN-Medium',
                },
                c: {
                    color: '#fff',
                    fontSize: 14,
                    fontWeight:'bold',
                    fontFamily: 'SourceHanSansCN-Medium',
                }
            },
        },
        emphasis:{
                selectorLabel: {
                    show: true,
                    fontSize: 32,
                    color: 'fff'
                }

        },
        data:legdata,
    },
    series: [
        {
            name: '类别',
            type: 'pie',
            // legendHoverLink: false,
            //hoverAnimation: false,
            radius: ['40%', '52%'],
            center: ['50%', '35%'],  // 调整环图的位置到画布中心
            label: {
                show: false,
            },
              emphasis: {
                label: {
                    show: false,
                },
            },
            selectedMode: 'single',
            selectedOffset:1,
            itemStyle: {
                borderColor: 'rgb(255, 255, 255)',
                borderWidth: 2,
            },
            data: data,
        }
    ]
};

myChart.setOption(option);
getDefaultSelected(myChart);

function getDefaultSelected(myChart) {
  let index = 0;
  myChart.dispatchAction({
    type: "highlight",
    seriesIndex: 0,
    dataIndex: 0,
  });

  myChart.on("click", function (params) {
    console.log(params.name);
    for (var i = 0; i < data.length; i++) {
      data[i].selected = false;
      myChart.dispatchAction({
        type: "downplay",
        seriesIndex: 0,
        dataIndex: i,
      });
    }
    const idx = data.findIndex((el) => el.name == params.name);
    if (idx !== -1) {
      console.log("下标", data);
      data[idx].selected = true;
    }
  const percentage = (params.data.value / sum * 100).toFixed(2);
    myChart.setOption({
        title: {
            //text: "{a|" + percentage + "%}\n{b|" + params.data.name + "}",
            text: "{a|" + percentage + "}{p|%}\n{b|" + params.data.name + "}",
            x: '50%',  // 水平居中
            y: '35%',  // 垂直居中
            textAlign: 'center',
            textVerticalAlign: 'middle',
            textStyle: {
                fontSize: '28',
                color: '#fff',
                fontWeight: 'normal',
                fontFamily: 'DIN-Medium',
                rich: {
                    a: {
                        fontSize: 28,
                       color: '#fff',
                    },
                    b: {
                        fontSize: 14,
                        color: '#fff',

                    },
                    p: {
                    fontSize: 12,  // 调整 % 号的字体大小
                    color: '#fff',
                    padding: [-10, 0, 0, 2]
                }
                }
            },
        }
    });
    myChart.dispatchAction({
      type: "highlight",
      seriesIndex: 0,
      dataIndex: idx,
    });
  });
}
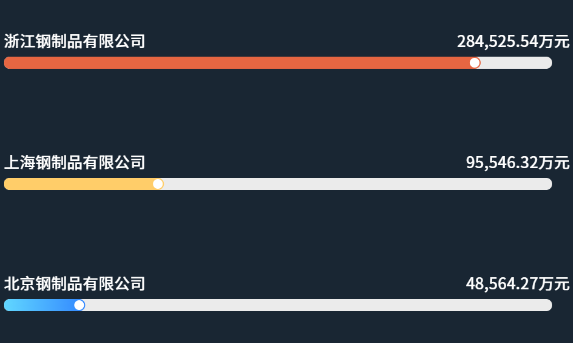
案例6:运输协议条形图
案例效果

配置过程
准备图表数据(该数据由后台获取)
[
 {
     "数值": 284525.54,
     "系列": "收入",
     "公司Title": "",
     "公司": "浙江钢制品有限公司",
     "系列Title": ""
 },
 {
     "数值": 95546.32,
     "系列": "收入",
     "公司Title": "",
     "公司": "上海钢制品有限公司",
     "系列Title": ""
 },
 {
     "数值": 48564.27,
     "系列": "收入",
     "公司Title": "",
     "公司": "北京钢制品有限公司",
     "系列Title": ""
 },
 {
     "数值": 33115.89,
     "系列": "收入",
     "公司Title": "",
     "公司": "上海钢制品有限公司",
     "系列Title": ""
 },
 {
     "数值": 33220.44,
     "系列": "收入",
     "公司Title": "",
     "公司": "深圳钢制品有限公司",
     "系列Title": ""
 },
 {
     "数值": 32544.22,
     "系列": "收入",
     "公司Title": "",
     "公司": "天津钢制品有限公司",
     "系列Title": ""
 },
 {
     "数值": 32152,
     "系列": "收入",
     "公司Title": "",
     "公司": "山东钢制品有限公司",
     "系列Title": ""
 }
]
编写echarts构建代码
const data = [], bMax = [], yTxt = [], yData = [];

const xData = [...new Set(datas.map((v) => v.数值))];
//取最大值方法
Array.max = function (array) {
    return Math.max.apply(Math, array);
};
//调用
const xMax = Array.max(xData);

datas.forEach((item, i) => {
    yData.push(item.公司);
    yTxt.push(item.数值);
    bMax.push(xMax * 1.15);
    data.push({
        name: item.公司,
        value: item.数值,
    });
});

const option = {
    grid: {
        left: 6,
        top: 10,
        right: -10,
        bottom: -10
    },
    // legend: {
    //     top: 10,
    //     right: 10,
    //     //是否显示
    //     show: false,
    //     //图例类型(四边形:rect、圆:circle、四边形圆角:roundRect、三角形:triangle、菱形:diamond、等)官网https://echarts.apache.org/zh/option.html#legend.icon
    //     icon: "roundRect",
    //     //图例宽度
    //     itemWidth: 16,
    //     //图例高度
    //     itemHeight: 16,
    //     //字体设置
    //     textStyle: {
    //         color: '#D3E9FF',
    //         fontSize: 13,
    //         fontFamily: 'SourceHanSansCN-Medium',//PingFangSC-Regular
    //     },
    //     itemStyle:{
    //         color:'#FFCF7A'
    //     }
    // },
     //提示框
    tooltip: {
        //显示类型(数据项图形触发,主要在散点图,饼图等无类目轴的图表中使用:item。坐标轴触发,主要在柱状图,折线图等会使用类目轴的图表中使用:axis)
        trigger: 'axis',
        //是否显示(默认值为true,关闭为false)
        show: false,
        //是否将 tooltip 框限制在图表的区域内。
        confine:true,
        //边框线宽度
              borderWidth:0,
              //背景颜色
              backgroundColor: "rgba(10,20,30,0.55)",
              //字体设置
              textStyle:{
                  fontSize: 14,
                  fontFamily: 'SourceHanSansCN-Medium',//PingFangSC-Regular
            color:'#fff'
        },
        //指示器
        axisPointer: {
            //显示类型('line'直线指示器、'shadow'阴影指示器、'none'无指示器、'cross'十字准星指示器)
            type: 'none',
            //指示线颜色
            lineStyle: {
                color: 'rgb(15,156,214)',
            },
        },
        //自定义提示样式
        formatter: function (params) {
            let str ="<div style='text-align:center;'>" + params[0].name + '<br />' + "</div>";
            params.forEach((item) => {
                var value = Math.abs(item.value);
                if (value > 999) {
                    let parts = value.toString().split('.');
                    parts[0] = parts[0].replace(/\B(?=(\d{3})+(?!\d))/g, ',');//3->6
                    value = parts.join();
                }
                str +=
                    '<span style="display:inline-block;margin-right:5px;border-radius:50%;width:10px;height:10px;left:10px;background-color:' +
                    item.color +
                    '"></span>' +
                    item.seriesName +
                    ' : ' +
                    value +
                    '万元<br />';
            });
            return str;
        },
    },
    xAxis: {
        show: false,
        type: 'value',
    },
    yAxis: [
        {
            type: 'category',
            inverse: true,
            axisLabel: {
                show: true,
                padding: [-36, 0, 0, 0],//使文字纵向偏移
                textStyle: {
                    align: 'left',
                    // color:function(val,index){
                    //   return index < 1 ? '#FFCF7A' :'#7BB2FF'//字体颜色判断
                    // },
                     color: '#fff',
                    fontSize: '13',
                    fontFamily: 'SourceHanSansCN-Medium',//PingFangSC-Regular
                },
            },
            offset:-8,//横向偏移
            splitLine: {
                show: false,
            },
            axisTick: {
                show: false,
            },
            axisLine: {
                show: false,
            },
            data: yData,
        },
        {
            triggerEvent: true,
            show: true,
            inverse: true,
            offset:-25,//横向偏移
            data: yTxt,
            axisTick: 'none',
            axisLine: 'none',
            axisLabel: {
                // color:function(val,index){
                //       return index < 1 ? '#FFCF7A' :'#7BB2FF'//字体颜色判断
                //   },

               formatter: function(value) {
                return value.toString().replace(/\B(?=(\d{3})+(?!\d))/g, ',')+'万元';
            },
                color:'#fff',
                fontFamily: 'SourceHanSansCN-Medium',
                align: 'right',
                padding: [-36, 0, 0, 0],//使文字纵向偏移
                fontSize: 13,

                },
        },
    ],
    dataZoom: [{
        yAxisIndex: [0,1],
        disabled: false,
        zoomLock: true,
        type: 'inside',
        startValue: 0,
        endValue: 2
    }],
    series: [
            {
            //name: "XXX",
            type: "pictorialBar",
            symbolPosition: "end",//'start':图形边缘与柱子开始的地方内切。'end':图形边缘与柱子结束的地方内切。'center':图形在柱子里居中。
            symbolSize: [8,8],//设置大小
            symbolOffset: [-1, 0],//设置偏移
            z: 12,
            itemStyle: {
              normal: {
                color: "#fff",//设置颜色
                },
              },
            data: data,//数据位置
          },//条形图顶端添加白色圆球
          {
            type: 'bar',
            name:'收入',
            barWidth: 10,

            barCategoryGap: "80%",
            z: 10,
            label: {
                show: false,
                position:'top',
                textStyle: {
                    align:'right',
                    color:'#7BB2FF',
                    fontFamily: 'SourceHanSansCN-Medium',//PingFangSC-Regular
                    fontSize: 13,
                },
            },
            itemStyle: {
                normal: {
                    barBorderRadius:[6,6,6,6],
                    color: (val) => {
                        if (val.dataIndex < 1 ) {//判断系列条颜色
                            return new echarts.graphic.LinearGradient(1, 0, 0, 0, [
                            {
                                offset: 0,
                                 color: '#E66642',
                            },
                            {
                                offset: 1,
                                color: '#E66642',
                            },
                        ]);
                        } if (val.dataIndex < 2 ) {//判断系列条颜色
                            return new echarts.graphic.LinearGradient(1, 0, 0, 0, [
                            {
                                offset: 0,
                                color: '#FFCD69',
                            },
                            {
                                offset: 1,
                                color: '#FFCD69',
                            },
                        ]);
                        } else {
                            return new echarts.graphic.LinearGradient(1, 0, 0, 0, [
                            {
                                offset: 0,
                                color: 'rgba(50, 135, 255, 1)',
                            },
                            {
                                offset: 1,
                                color: 'rgba(97, 215, 255, 1)',
                            },
                            ])
                        }
                    },
                },

            },
            data: data,
        },
        {//背景
            type: 'bar',
            barWidth: 10,
            barGap: '-100%',
            z: 0,
            tooltip:{
              show:false
            },
            itemStyle: {
                barBorderRadius:[6,6,6,6],
                color: 'rgba(235, 235, 235, 1)',
            },
            data: bMax,
        }
    ],
};
myChart.setOption(option);
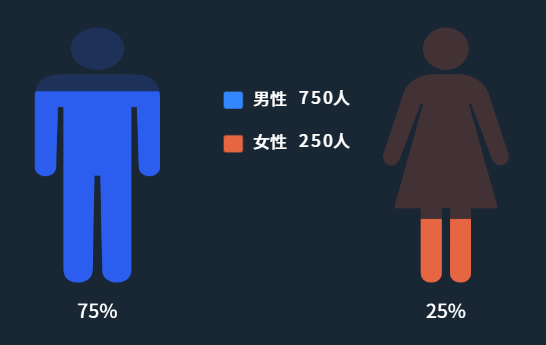
案例7:男女比例图
案例效果

配置过程
- 编写echarts构建代码
var symbols = [
    'path://M18.2629891,11.7131596 L6.8091608,11.7131596 C1.6685112,11.7131596 0,13.032145 0,18.6237673 L0,34.9928467 C0,38.1719847 4.28388932,38.1719847 4.28388932,34.9928467 L4.65591984,20.0216948 L5.74941883,20.0216948 L5.74941883,61.000787 C5.74941883,65.2508314 11.5891201,65.1268798 11.5891201,61.000787 L11.9611506,37.2137775 L13.1110872,37.2137775 L13.4831177,61.000787 C13.4831177,65.1268798 19.3114787,65.2508314 19.3114787,61.000787 L19.3114787,20.0216948 L20.4162301,20.0216948 L20.7882606,34.9928467 C20.7882606,38.1719847 25.0721499,38.1719847 25.0721499,34.9928467 L25.0721499,18.6237673 C25.0721499,13.032145 23.4038145,11.7131596 18.2629891,11.7131596 M12.5361629,1.11022302e-13 C15.4784742,1.11022302e-13 17.8684539,2.38997966 17.8684539,5.33237894 C17.8684539,8.27469031 15.4784742,10.66467 12.5361629,10.66467 C9.59376358,10.66467 7.20378392,8.27469031 7.20378392,5.33237894 C7.20378392,2.38997966 9.59376358,1.11022302e-13 12.5361629,1.11022302e-13',
    'path://M28.9624207,31.5315864 L24.4142575,16.4793596 C23.5227152,13.8063773 20.8817445,11.7111088 17.0107398,11.7111088 L12.112691,11.7111088 C8.24168636,11.7111088 5.60080331,13.8064652 4.70917331,16.4793596 L0.149791395,31.5315864 C-0.786976655,34.7595013 2.9373074,35.9147532 3.9192135,32.890727 L8.72689855,19.1296485 L9.2799493,19.1296485 C9.2799493,19.1296485 2.95992025,43.7750224 2.70031069,44.6924335 C2.56498417,45.1567684 2.74553639,45.4852068 3.24205501,45.4852068 L8.704461,45.4852068 L8.704461,61.6700801 C8.704461,64.9659872 13.625035,64.9659872 13.625035,61.6700801 L13.625035,45.360657 L15.5097899,45.360657 L15.4984835,61.6700801 C15.4984835,64.9659872 20.4191451,64.9659872 20.4191451,61.6700801 L20.4191451,45.4852068 L25.8814635,45.4852068 C26.3667633,45.4852068 26.5586219,45.1567684 26.4345142,44.6924335 C26.1636859,43.7750224 19.8436568,19.1296485 19.8436568,19.1296485 L20.3966199,19.1296485 L25.2043926,32.890727 C26.1862111,35.9147532 29.9105828,34.7595013 28.9625083,31.5315864 L28.9624207,31.5315864 Z M14.5617154,0 C17.4960397,0 19.8773132,2.3898427 19.8773132,5.33453001 C19.8773132,8.27930527 17.4960397,10.66906 14.5617154,10.66906 C11.6274788,10.66906 9.24611767,8.27930527 9.24611767,5.33453001 C9.24611767,2.3898427 11.6274788,0 14.5617154,0 L14.5617154,0 Z',
    // 'path://M512 292.205897c80.855572 0 146.358821-65.503248 146.358821-146.358821C658.358821 65.503248 592.855572 0 512 0 431.144428 0 365.641179 65.503248 365.641179 146.358821 365.641179 227.214393 431.144428 292.205897 512 292.205897zM512 731.282359c-80.855572 0-146.358821 65.503248-146.358821 146.358821 0 80.855572 65.503248 146.358821 146.358821 146.358821 80.855572 0 146.358821-65.503248 146.358821-146.358821C658.358821 796.273863 592.855572 731.282359 512 731.282359z'
];
var bodyMax = 100; //指定图形界限的值
var labelSetting = {
    normal: {
        show: true,
        position: 'bottom',
        offset: [0, 10],
        formatter: function(param) {
            return (param.value / bodyMax * 100).toFixed(0) + '%';
        },
        textStyle: {
            fontSize: 16,
            fontFamily: 'SourceHanSansCN-Medium',
            color: '#fff'
        }
    }
};

var markLineSetting = { //设置标线
    symbol: 'none',
    lineStyle: {
        normal: {
            opacity: 0.4
        }
    },
    data: [{
        type: 'max',
        label: {
            normal: {
                formatter: 'max: {c}'
            }
        }
    }, {
        type: 'min',
        label: {
            normal: {
                formatter: 'min: {c}'
            }
        }
    }]
};

const option = {
    tooltip: {
        show: false, //鼠标放上去显示悬浮数据
    },
    legend: {
        show:false,
        data: ['typeA', 'typeB'],
        selectedMode: 'single',
        itemWidth: 10, //图例的宽度
        itemHeight: 10, //图例的高度
        itemGap: 30,
        orient: 'horizontal',
        left: 'center',
        top: '20px',
        icon: 'rect',
        // selectedMode: false, //取消图例上的点击事件
        textStyle: {
            color: '#808492'
        },
    },
    grid: {
        left: '5%',
        right: '5%',
        top: '10%',
        bottom: '20%',
        containLabel: true
    },
    xAxis: {
        data: ['a', 'x', 'b'],
        axisTick: {
            show: false
        },
        axisLine: {
            show: false
        },
        axisLabel: {
            show: false
        }
    },
    yAxis: {
        max: bodyMax,
        splitLine: {
            show: false
        },
        axisTick: {
            // 刻度线
            show: false
        },
        axisLine: {
            // 轴线
            show: false
        },
        axisLabel: {
            // 轴坐标文字
            show: false
        }
    },
    series: [
        {
            name: 'typeA',
            type: 'pictorialBar',
            symbolClip: true,
            symbolBoundingData: bodyMax,
            label: labelSetting,
            symbolSize:['90%','100%'],
            data: [{
                    value: 75,
                    symbol: symbols[0],
                    itemStyle: {
                        normal: {
                             //单独控制颜色、
                            color: 'rgba(43, 94, 239, 1)'
                        }
                    },
                },
                {

                },
                {
                    value: 25,
                    symbol: symbols[1],
                    itemStyle: {
                        normal: {
                            color: '#E66642' //单独控制颜色
                        }
                    },
                }
            ],
            // markLine: markLineSetting,
            z: 10
        },
        {
            name: 'typeB',
            type: 'pictorialBar',
            symbolClip: true,
            symbolBoundingData: bodyMax,
            label: labelSetting,
            symbolSize:['90%','100%'],
            data: [{
                    value: 75,
                    symbol: symbols[0]
                },
                {
                    value: 35,
                    symbol: symbols[1]
                }
            ],
            // markLine: markLineSetting,
            z: 10
        },
        {
            // 设置背景底色,不同的情况用这个
            name: 'full',
            type: 'pictorialBar', //异型柱状图 图片、SVG PathData
            symbolBoundingData: bodyMax,
            symbolSize:['90%','100%'],
            animationDuration: 0,
            itemStyle: {
                normal: {
                    color: '#2B5EEF' //设置全部颜色,统一设置
                }
            },
            z: 10,
            data: [
                {
                    itemStyle: {
                        normal: {
                            color: 'rgba(43, 94, 239, 0.2)' //单独控制颜色
                        }
                    },
                    value: 100,
                    symbol: symbols[0]
                },
                {
                    // 设置中间冒号
                    itemStyle: {
                        normal: {
                            color: '#d6e7ff' //单独控制颜色
                        }
                    },
                    value: 0,
                    symbol: symbols[2],
                    symbolSize: [0, '18%'],
                    symbolOffset: [0, '-200%']
                },
                {
                    itemStyle: {
                        normal: {
                            color: 'rgba(230, 102, 66, 0.2)' //单独控制颜色
                        }
                    },
                    value: 100,
                    symbol: symbols[1]
                }
            ]
        }
    ]
}

myChart.setOption(option);
最后编辑:倪 更新时间:2025-11-28 11:30
 扫码关注网盛数新公众号,获取更多帮助资料

