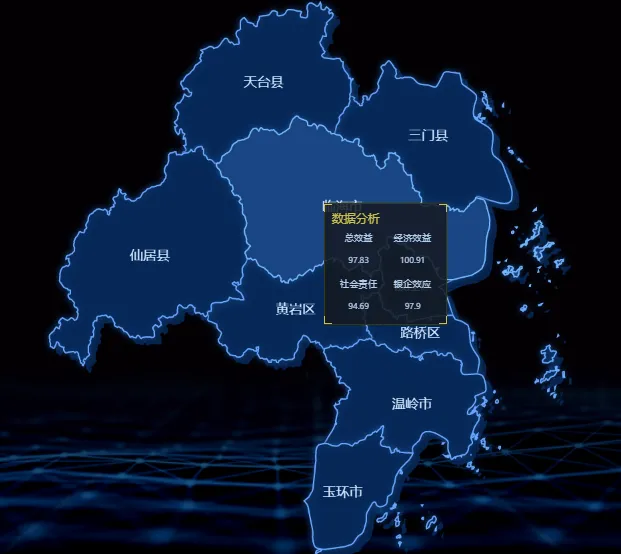
实例模板
应用:大屏项目二次开发
模板路径:应用空间-台州金融驾驶舱-地图模块-台州geoJson (hte_2021_01_22092245117)
模板下载
1、预览效果
浏览需要跨域
2、实现原理
基于乐创者报表(lczReport)中单元格的自定义控件功能+geoJson+echarts实现。
3、配置步骤
3.1、引入台州市geoJson
3.2、报表模板中设置自定义控件
3.3、配置脚本
ER.widget.extend(this, {
    type: 'echarts',
    handleChartClickEvent: function (params) {
        let data = params.data;
        // 有数据,联动

        console.log(data);
        $('.legendButton').css({
            visibility: 'visible'
        })
        $(".legendButton p").css({
            "background-image": "url("+unSelectedButton+")",
            "background-repeat": "no-repeat",
            "color": "rgba(214, 231, 255, 100)",
        })
        cityCode = data.code;
        if (data) {
            variants = []
            variants.push({
                'name': 'city',
                value: data.name
            })
            variants.push({
                'name': 'code',
                'value': data.code
            });
            if (!data.type) {
                data.type = ''
            }
            variants.push({
                name:'type',
                value:data.type,
            })
            this.handleLinkage(variants);
        }
        // 超链接
        // this.handleLink('Link1',[{name:'chartName',value:params.data.name},{name:'chartValue',value:params.data.value}])
    },
    init: function (datas, element, echarts) {
        // let nameSelected = "浙江省";
        echarts.registerMap('台州市', tzs);
        myChart = echarts.init(element);
        console.log(datas);
        option = {
            tooltip: {
                show: true,
                // position: [400, 10],
                padding: '0px',
                // alwaysShowContent: true,
                formatter: function (params) {
                    let data = params.data;
                    let str = ''
                    str +=
                        "<div class=box>" +
                        "<div class=angle></div>" +
                        "<div class=head-line>数据分析</div>" +
                        "<div class=main>" +
                        "<div class=item>" +
                        "<span>总效益</span>" +
                        "<p>" + data.total + "</p>" +
                        "</div>" +
                        "<div class=item>" +
                        "<span>经济效益</span>" +
                        "<p>" + data.economic + "</p>" +
                        "</div>" +
                        "<div class=item>" +
                        "<span>社会责任</span>" +
                        "<p>" + data.social + "</p>" +
                        "</div>" +
                        "<div class=item>" +
                        "<span>银企效应</span>" +
                        "<p>" + data.bank + "</p>" +
                        "</div>" +
                        "</div>" +
                        "</div>"
                    return str;
                }
            },
            geo: {
                show: true,
                map: '台州市',
                zoom: 1.2,
                itemStyle: {
                    areaColor: '#062858',
                    color: 'rgba(64, 133, 230, 0.61)',
                    borderColor: 'rgba(107, 168, 255, 1)',
                    opacity: 0.8,
                    borderType: 'solid',
                    borderWidth: 2,
                    shadowColor: '#062858',
                    shadowOffsetX: 10,
                    shadowOffsetY: 10
                },
            },
            series: [{
                    name: '台州市',
                    type: 'map',
                    map: '台州市',
                    selectedMode: 'single',
                    label: { //字体配置
                        normal: {
                            color: 'rgba(214, 231, 255, 100)',
                            show: true,
                            fontFamily: 'TRENDS',
                            align: 'left',
                            verticalAlign: 'middle',
                            fontSize: 20,
                            // position:['50%', '50%']
                        }
                    },
                    zoom: 1.2,
                    itemStyle: {
                        areaColor: '#062858',
                        opacicy: 0.6,
                        borderColor: 'rgba(107, 168, 255, 1)',
                        borderType: 'solid',
                        borderWidth: 2,
                        shadowColor: '#14417F',
                        shadowBlur: 10
                    },
                    emphasis: {
                        itemStyle: {
                            areaColor: '#1A4684',
                        },
                        label: {
                            color: 'rgba(214, 231, 255, 100)'
                        }

                    },
                    data: getData(datas)
                },

            ]
        };

        function getData(datas) {
            var dataList = [];
            var content = datas.content;
            for (let i = 0; i < content['id'].length; i++) {
                var temp = {
                    time: content['时间'][i],
                    code: content['区域编号'][i],
                    name: content['区域名称'][i],
                    total: content['总效益'][i],
                    social: content['社会责任'][i],
                    bank: content["银行效益"][i],
                    economic: content['经济效益'][i]
                };
                dataList.push(temp);
            }
            return dataList;
        }
        myChart.setOption(option)
        myChart.on("click", this.onChartClick);
        $("<div class='legendButton'>" +
            "<p>银行</p>" +
            "<p>行业</p>" +
            "<p>企业</p>" +
            "</div>"
        ).insertAfter(element)
        var that = this;
        $(".legendButton p").click(function () {
            console.log(that)
            var value =$(this).text()
            $(this).siblings().css({
                "background-image": "url("+unSelectedButton+")",
                "background-repeat": "no-repeat",

                "color": "rgba(214, 231, 255, 100)",
            })
            $(this).css({
                "background-image": "url("+selectedButton+")",
                "color": "rgba(255, 244, 128, 100)"
            })
            if (value) {
                variants = []
                variants.push({
                    'name': 'city',
                    value: ''
                })
                variants.push({
                    'name': 'code',
                    'value': cityCode
                });
                variants.push({
                    'name': 'type',
                    'value': value
            });
            // debugger;
            that.handleLinkage(variants);
        }

        })
    }

})
作者:倪 创建时间:2024-07-25 10:12
最后编辑:倪 更新时间:2026-01-23 11:33
最后编辑:倪 更新时间:2026-01-23 11:33
 扫码关注网盛数新公众号,获取更多帮助资料
